- Logging in Docker
- Logging in Kubernetes
- Logging Architectures in Containerized Environments
- Conclusion
- References
Logs are essential for the development and troubleshooting of containers. Containers utilize a specialized logging framework for various reasons, such as isolation, standardization, and managing scalability.
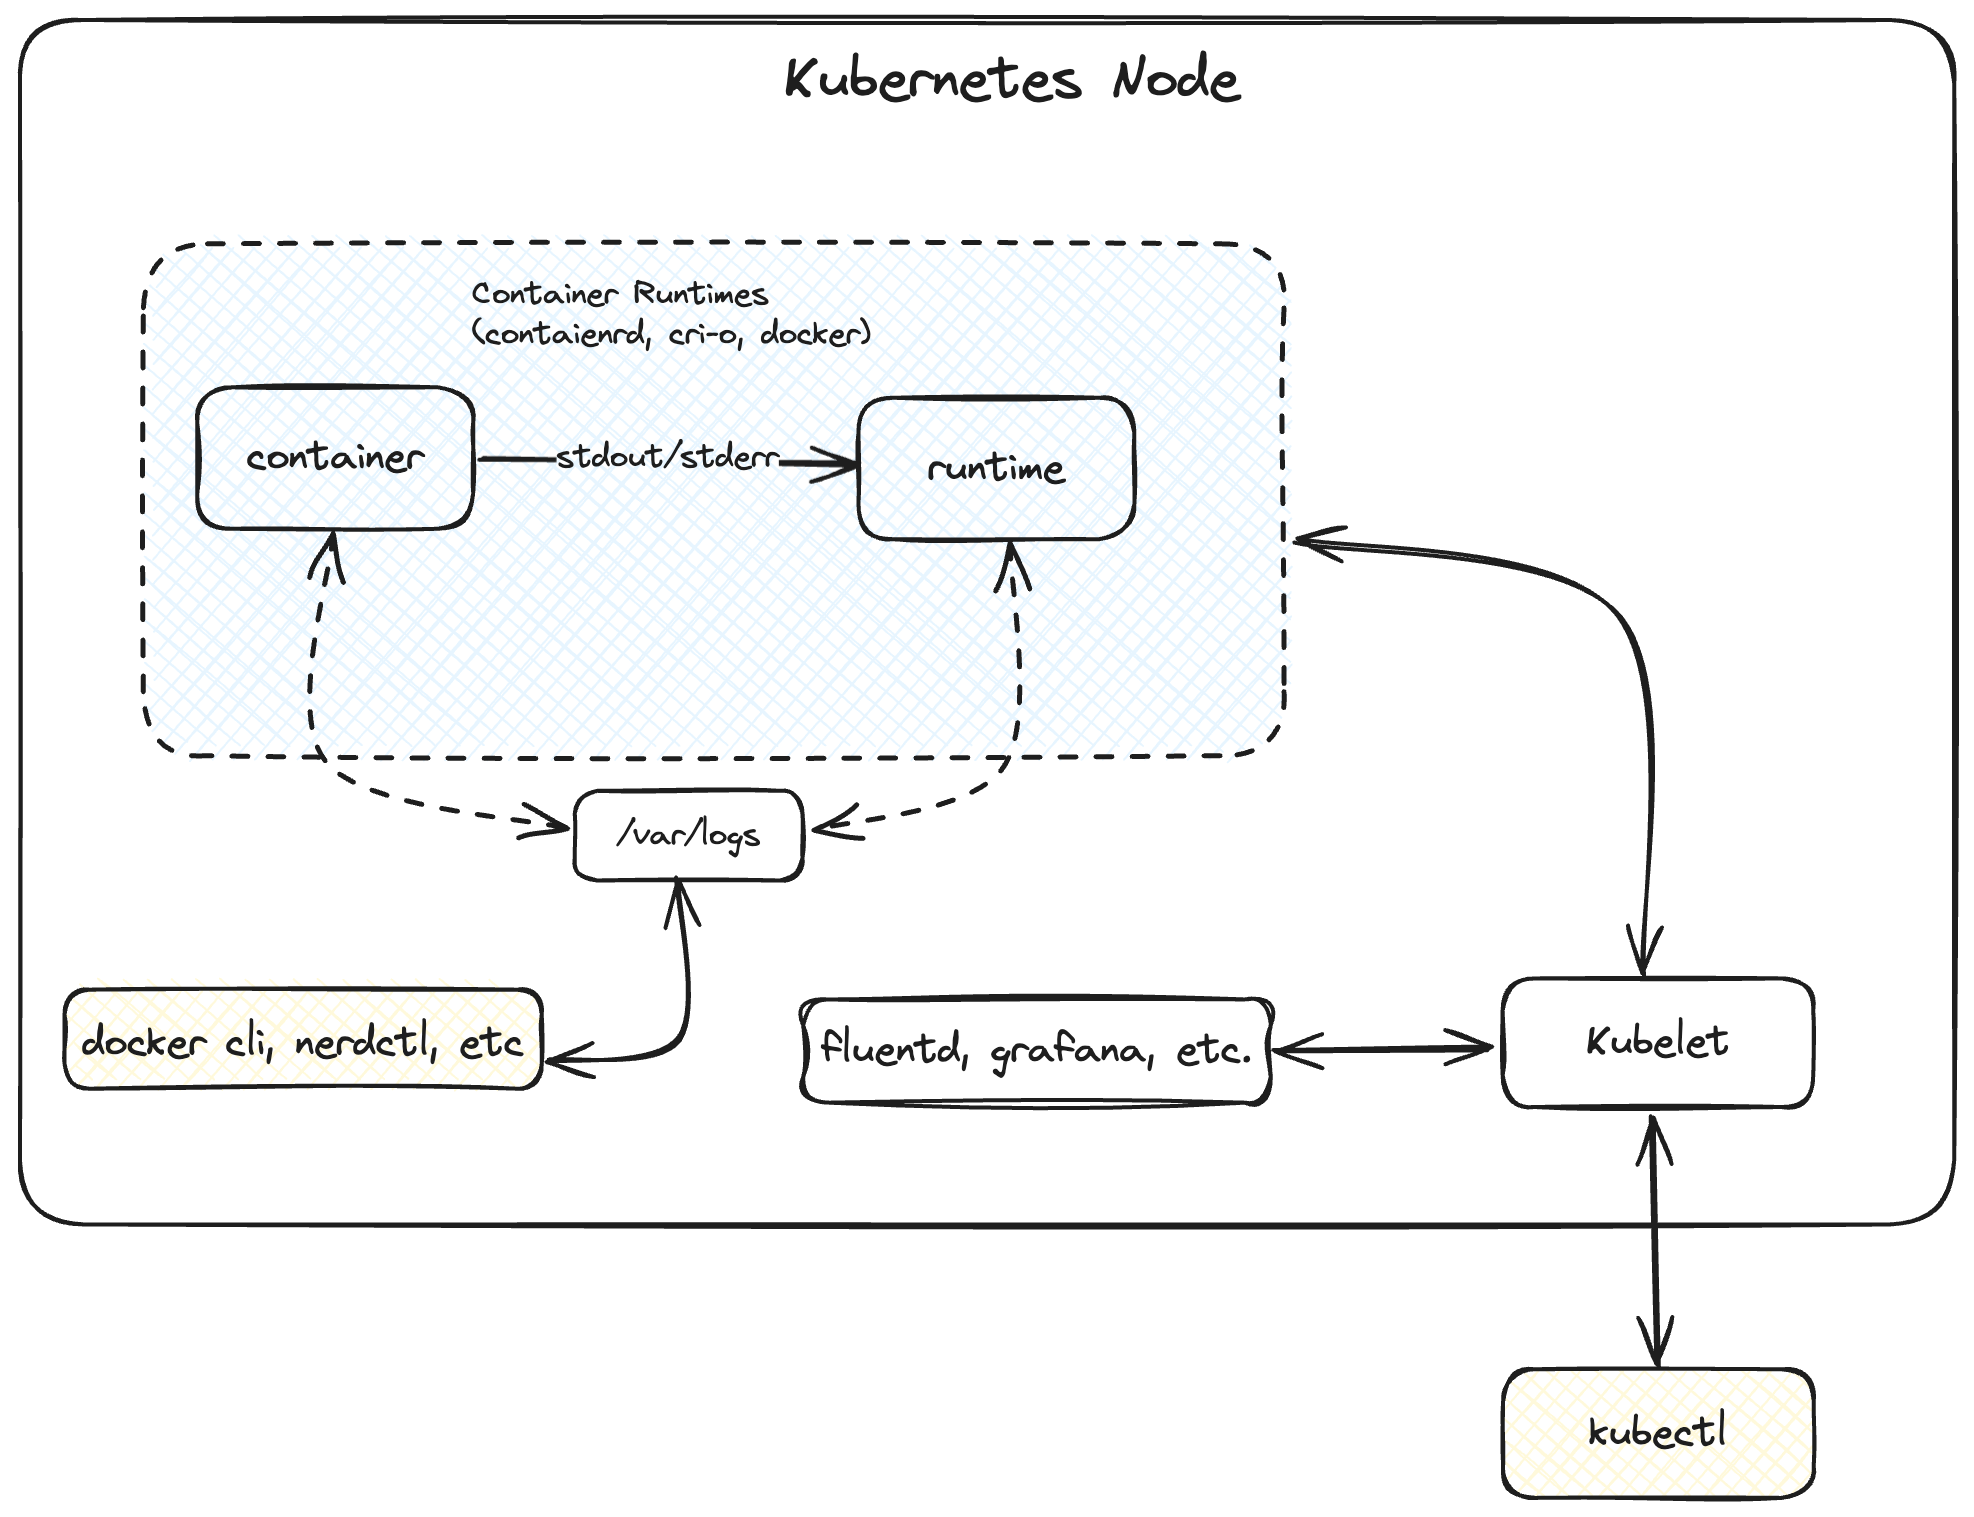
When a container starts, the container runtime (such as containerd, runc, cri-o, or docker) captures the standard output (stdout) and standard error (stderr) streams from the application running in the container. These logs are then written to a file, typically located at /var/log/<docker/containerd/pod>. This log directory can be mounted on the host system, allowing logs to be persisted and accessed even after the container stops. Various command-line tools, such as docker and nerdctl, can then read these log files to display the container’s logs to users.
Logging in Docker Link to heading
Docker includes multiple logging mechanisms to help you get information from running containers and services. These mechanisms are called logging drivers. Docker uses logging drivers to manage specialized logging for containers 1. The default json-file logging drivers capture the standard output and standard error streams and write each log into a JSON format with the following structure:
{
  "log": "Log line is here\n",
  "stream": "stdout",
  "time": "2019-01-01T11:11:11.111111111Z"
}
Delivery Modes Link to heading
Blocking Delivery Link to heading
A container in blocking mode—Docker’s default mode—will interrupt the application each time it needs to deliver a message to the driver. This guarantees that all messages will be sent to the driver, but it can have the side effect of introducing latency in the performance of your application; if the logging driver is busy, the container delays the application’s other tasks until it has delivered the message 2.
The potential effect of blocking mode on the performance of your application depends on which logging driver you choose. For example, the json-file driver writes logs very quickly since it writes to the local file system, so it’s unlikely to block and cause latency. On the other hand, drivers that need to open a connection to a remote server—such as gcplogs and awslogs—are more likely to block for longer periods and could cause noticeable latency 2.
Non-Blocking Delivery Mode Link to heading
In non-blocking mode, a container first writes its logs to an in-memory ring buffer, where they’re stored until the logging driver is available to process them. Even if the driver is busy, the container can immediately hand off the application output to the ring buffer and resume executing the application. This ensures that a high volume of logging activity won’t affect the application’s performance running in the container 2.
In contrast to the blocking delivery mode, the non-blocking delivery mode does not guarantee that the logging driver will pick up all logs. If the application emits logs faster than the driver can process, the ring buffer can overflow, leading to missing logs. The max-buffer-size can be used to increase the ring buffer’s size to handle the logs’ parsing. The default value of max-buffer-size is 1 megabyte.
Log Rotation Link to heading
By default, the support logging drivers do not support log rotation. This can increase disk usage for containers when using log drivers like json-file.
In such cases, it can be helpful to switch to the local logging driver, which is optimized for performance and disk usage by support log rotation by default.
The local logging driver, unlike some other drivers, is optimized for performance and disk usage by supporting log rotation by default. When using the local driver, its default configuration preserves 100MB of log messages per container and uses automatic compression to reduce disk size. The default size of each log file is 20 MB. Once a log file reaches the 20 MB limit, a new file is created. By default, the local driver maintains 5 such files per container to handle log rotation 3.
Logging in Kubernetes Link to heading
When containers are deployed to a Kubernetes cluster, they run inside a pod on a node. The container runtime is installed on the node, and the Kubelet process is responsible for managing all the containers on the node.
The container runtime handles and redirects all the logs generated by the containers through the stdout and stderr streams. Different container runtimes implement this differently; however, the integration with the kubelet is standardized as the CRI logging format 4.
The kubelet makes logs available to clients via a unique feature of the Kubernetes API. The usual way to access this is by running kubectl logs.
Log Rotation in Kubernetes Link to heading
The Kubelet is responsible for rotating a container’s logs and managing the logging directory structure. It sends this information to the Container Runtime Interface (CRI) so that it can write logs to the given location.
The Kubelet’s containerLogMaxSize (default 10Mi) and containerLogMaxFiles (default 5) can be configured to manage log rotation. (Refer to Kubelet’s configuration arguments for more details).
To perform an efficient log rotation in clusters where the volume of the logs generated by the workload is large, kubelet also provides a mechanism to tune how the logs are rotated in terms of how many concurrent log rotations can be performed and the interval at which the logs are monitored and rotated as required. You can configure two kubelet configuration settings, containerLogMaxWorkers and containerLogMonitorInterval, using the kubelet configuration file 4.
Logging Architectures in Containerized Environments Link to heading
The following are the common logging patterns considered for collecting container logs:
- Use a node-level logging agent when it runs on every host.
- Using a dedicated sidecar container with a logging agent.
- Push logs directly from the container to the logging backend.
Let’s explore each of the logging architectures in more detail.
Using a node-level logging agent Link to heading
As mentioned above, a container collects logs and stores them in a directory structure that can be mounted on the host. Once the directory is mounted, a log collection agent can run on the host and access the log directories to collect and push logs to the logging backend. This is the most commonly used log aggregation architecture for containers.
In Kubernetes, a DaemonSet can be used to run a log collector on each node which can access the logging directories and push the logs to a logging aggregator.
Node-level logging creates only one agent per node and doesn’t require any changes to the applications running on the node.
Some examples of log collectors include Datadog, Grafana, Fluentd and Filebeat.
Using a sidecar container with a logging agent Link to heading
You can use a sidecar container that can be configured to run with the application container, which can do one of the following:
- The sidecar can stream the application logs to its stdout
- The sidecar container can run a logging agent to scrape logs from the application container and push them to a log aggregator.
Details about these approaches are explained excellently in the Kubernetes official documentation..
Using the sidecar-based approach has certain disadvantages.
- Using sidecar-based logging can be problematic for Jobs, where the sidecar can keep the container running.
- Sidecars require additional CPU and memory usage.
- If a sidecar is streaming an application’s logs to its own log stream, then it is not a good practice to stream different log streams into one stream. In this case, there would be a need to create different sidecars for different log streams.
- If the sidecar container is scraping logs and running a logging agent to push the logs to the log aggregator, then fetching logs with
kubectl logswill not work since the kubelet no longer manages logs.
Push logs directly from the container to the logging backend Link to heading
The containers can be configured to collect their logs and push them directly to the logging aggregator. This approach allows the application to control how the logs are moved to the logging aggregator. However, this approach comes with the caveat that the application needs to be integrated with a log scraping and pushing mechanism. This can make the application more complex and challenging to troubleshoot. Furthermore, fetching logs with kubectl logs will not work since logs are not managed by the kubelet.
Pushing logs directly from the container shifts the responsibility of log aggregation to the application itself. This approach can be beneficial in scenarios where an application requires custom log handling or needs to aggregate logs independently from the cluster-wide logging system. However, it’s important to consider the added complexity this method introduces to the application and its potential impact on maintainability.
Conclusion Link to heading
Container logging is a crucial aspect of modern application development and management. We’ve explored various logging mechanisms in Docker and Kubernetes, from basic log capture to advanced architectures like node-level agents and sidecars. Each approach offers unique benefits and trade-offs in terms of performance, scalability, and ease of implementation.
As container environments continue to evolve, effective logging strategies become increasingly important for debugging, monitoring, and maintaining applications. Whether you choose to use node-level logging agents, sidecar containers, or direct log pushing, the key is to implement a solution that best fits your specific use case and infrastructure requirements.
By understanding these logging concepts and architectures, developers and operations teams can make informed decisions to enhance their container observability and streamline their troubleshooting processes.